
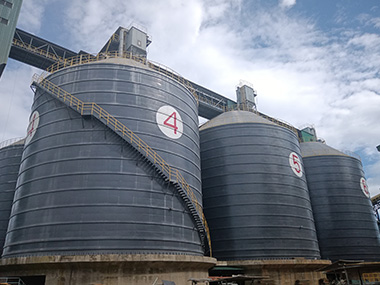

Steel Silo 3D Level Scanning: What It Actually Does and Why Single-Point Sensors Keep Failing
3D level scanning measures the entire surface profile of bulk solids inside a steel silo — not just one spot. It gives you volume, mass, and a real-time shape map of the material surface, including cones, rat-holes, and buildup. For cement, clinker, coal, and fly ash silos, it's the difference between knowing you have "some material left" and knowing you have 847 tonnes with a 2.3-metre rat-hole forming on the north wall.
Why Traditional Level Measurement Falls Short in Bulk Solids
The Single-Point Problem
Most plants still run with one or two radar or guided-wave sensors mounted at the silo centre or offset by a fixed angle. That works fine for liquids. Liquids find their level. Bulk solids don't.
I've stood on top of a 4,200-tonne clinker silo in Vietnam where the single radar read 68% full. The operator trusted it. When they started the discharge system, the actual volume was closer to 41% — the rest was a hardened crust bridging across the centre chute. The resulting surge nearly tore the belt conveyor off its foundations. Nobody got hurt, but the plant lost 11 days.
Here's the thing: a single-point sensor assumes the surface is flat. In reality, you've got an inlet cone, a discharge cone, side-wall buildup, rat-holes, and sometimes a completely asymmetric pile if the feed chute is offset. One measurement point can't capture any of that. It's like trying to describe a mountain range by measuring one peak.
Material Behavior That Defies Simple Assumptions
Bulk solids behave differently depending on particle size, moisture, aeration history, and how long they've been sitting. Cement that's been stored for more than 72 hours without aeration will develop a compacted zone near the walls. Coal with moisture above 8% will rat-hole aggressively. Fly ash — especially from certain coal blends — will fluidize unevenly and create channels that a single sensor interprets as "empty" when there's actually 60% material still in the silo.
The angle of repose isn't constant either. It shifts with moisture content, particle degradation during repeated handling, and the height of free-fall during filling. A silo designed for a 35° angle of repose might see actual surface slopes ranging from 28° to 45° depending on conditions. That's a massive volume calculation error if you're assuming a flat plane.
How 3D Level Scanning Actually Works
The Technology Behind It
3D level scanners use low-frequency acoustic or radar pulses — typically in the 3 to 15 kHz range for acoustic, or 6 to 26 GHz for radar variants — emitted from a rotating or multi-angle sensor head mounted on the silo roof. The device sends a pulse, listens for the return, and maps the time-of-flight and angle of each reflection.
Modern units take between 1,000 and 5,000 measurement points per scan cycle. A typical scan takes 30 to 90 seconds depending on silo diameter and the resolution setting. The output is a point cloud — an actual 3D surface map of the material inside the silo.
The low frequency matters. At 3 to 7 kHz, the acoustic pulse penetrates dust clouds that would blind a 26 GHz radar unit. I've seen 78 g/m³ dust concentrations during cement filling — that's thick enough to obscure your hand at arm's length. High-frequency radar drops out completely in those conditions. Low-frequency acoustic scanning keeps working.
What You Actually Get
The scanner outputs three things that matter operationally:
Volume. The system calculates the actual volume of material based on the 3D surface profile and the silo geometry you've programmed in. For a 25-metre-diameter cement silo, that's typically accurate to within ±1.5% of true volume. Compare that to a single-point sensor with a flat-plane assumption, which can be off by 15 to 30% when the surface is irregular.
Mass. If you input the bulk density — and you should, because it changes — the system converts volume to mass. For cement at 1.1 to 1.3 t/m³, that's the difference between ordering a truck fleet or not. For coal at 0.8 to 0.95 t/m³, it's the difference between a boiler trip and smooth operation.
Surface shape. This is the one nobody talks about enough. The system shows you the actual profile — where the high spots are, where rat-holes have formed, where wall buildup is accumulating. That's diagnostic data. It tells you when to run the aeration system, when to cycle the discharge gates, and when you've got a problem that'll become a structural issue if you ignore it.
Where 3D Scanning Delivers Real Value
Cement and Clinker Storage
Cement silos are the most common application, and for good reason. Cement is aerated, it compacts, it bridges, and it false-levels. A 3,000-tonne cement silo with a single radar might show 75% level when the actual usable volume is 50% because of wall buildup and a central rat-hole.
We installed 3D scanners on six cement silos at a plant in Indonesia — each 22 metres in diameter, 38 metres tall, rated for 5,000 tonnes. Before the scanners, the plant ran on manual dip measurements every 8 hours. Two guys with a weighted tape, climbing the silo roof in 36°C heat and 80% humidity. They hated it. The readings were inconsistent — different operators got different results from the same silo on the same day.
After installation, the plant eliminated manual dipping entirely. Inventory accuracy went from ±12% to ±2%. The procurement team could plan truck dispatches 48 hours ahead instead of guessing. That alone saved them roughly $180,000 per year in demurrage and emergency transport costs.
Coal and Fly Ash Silos
Coal presents a different challenge. It's dusty, it's abrasive, and it's often stored in large-diameter silos — 30 metres or more — where the surface area is enormous and the profile is almost never flat. A 30-metre-diameter coal silo with a 3-metre rat-hole represents roughly 280 tonnes of material that a single-point sensor can't see.
Fly ash is worse. It's light — bulk density around 0.7 to 0.9 t/m³ — and it fluidizes unpredictably. I've seen fly ash silos where the surface looked level from the top but was actually a thin crust over a fluidized pocket. When the discharge valve opened, the pocket collapsed and sent a 400-tonne surge into the feed bin below. The bin wasn't designed for that load. The support steel buckled.
3D scanning catches these conditions before they become incidents. The surface map shows the crust, the pocket, the asymmetry. You see it forming. You act on it.
Inventory Management and Process Integration
This is where the ROI argument gets serious. A 3D scanner integrated into your plant's SCADA or DCS system gives you continuous, automated inventory data. No manual readings. No operator-dependent errors. No gaps between measurements.
For plants running ISO 9001 or similar quality management systems, that data trail matters. You can prove stock levels, demonstrate FIFO compliance, and reconcile physical inventory against book inventory without a quarterly stocktake that shuts down operations for a day.
The integration itself is straightforward. Most 3D scanners output Modbus TCP, Profibus, or 4-20 mA signals. If your plant runs a modern DCS — and most do — the scanner becomes just another input. The silo geometry is programmed once during commissioning. After that, it runs.
Installation and Integration Considerations
Mounting and Positioning
The scanner mounts on the silo roof, typically through a 200 to 300 mm flanged opening. For existing silos, that means a hot-work permit, a crane or chain hoist, and about 4 hours of installation time per unit. For new silos, we specify the roof penetration during design — it's a 30-minute job during construction.
Positioning matters. The ideal mount point is centred on the roof, but that's not always possible. Offset mounting is fine — the scanner's software compensates for the angle — but you need to input the exact offset coordinates during commissioning. Get those wrong and your volume calculations will be systematically biased.
For silos larger than 30 metres in diameter, we sometimes specify two scanners. One can't always see the far wall at a useful angle. Two units with overlapping coverage eliminate blind spots. It adds cost — roughly $12,000 to $18,000 per additional unit installed — but for a 40-metre coal silo holding 15,000 tonnes, the coverage is worth it.
Environmental Challenges
Temperature at the silo roof can exceed 60°C in direct sun in the Middle East or North Africa. Most industrial-rated scanners operate from -40°C to +85°C, so that's within spec. But the cable runs — from the scanner down to the junction box, then to the control room — need to be rated for the ambient. We've seen PVC-jacketed cables degrade in 18 months on roofs in Qatar. Use armoured, UV-rated cable. It costs three times more and lasts ten times longer.
Dust is the other killer. The scanner's own housing is typically IP65 or IP66 rated, which handles rain and washdown. But the mounting flange and cable entry points need to be sealed properly. A dust ingress failure on a fly ash silo in India took 3 days to diagnose because the fault was intermittent — fine when the silo was empty, failed when dust concentration peaked during filling.
Integration with Plant Control Systems
The scanner outputs data. Your control system needs to use it. That sounds obvious, but I've seen plants where the scanner was installed, commissioned, and then ignored because nobody programmed the DCS to display the data on the operator's screen.
During commissioning, we work with the plant's automation team to map the scanner's outputs to the correct tags in the DCS. Volume, mass, surface profile, and alarm states — each gets a tag. The operator sees the same silo graphic they've always seen, but now it shows the actual surface shape instead of a single percentage bar.
Alarm configuration is critical. You want alerts for high level (obvious), but also for asymmetric filling, rat-hole detection, and rate-of-change anomalies. A sudden 5% volume drop in 30 seconds means something just collapsed inside the silo. That's not a level alarm — that's a process alarm, and it should trigger an operator response.
Cost-Benefit Reality Check
What It Costs
A single 3D level scanner unit — hardware only — runs between $8,000 and $22,000 depending on the model, silo diameter rating, and output options. Installation, commissioning, and integration add another $4,000 to $8,000 for a straightforward retrofit on an existing silo. For a new-build silo where the roof penetration is pre-planned, installation drops to $2,000 to $3,500.
So you're looking at $12,000 to $30,000 all-in per silo. For a plant with six cement silos, that's $72,000 to $180,000 total. Not trivial. But compare it to the cost of one unplanned shutdown caused by a silo running empty when the gauge said it was half-full. I've seen those shutdowns cost $50,000 to $200,000 per day in lost production.
What It Saves
The savings come from three places: eliminated manual measurement labour, reduced demurrage and emergency logistics, and prevented process incidents.
Manual dipping on a six-silo plant typically requires two operators for 2 hours per shift, three shifts per day. That's 36 labour-hours per day, roughly 13,140 hours per year. At a fully loaded labour cost of $25 to $40 per hour in most markets, that's $328,000 to $525,000 per year. A 3D scanning system eliminates 90% of that.
Demurriage savings are harder to quantify but real. When you know your actual inventory to within ±2%, you can schedule deliveries precisely. No more "send 5 trucks now because we think we're running low" followed by "we've got 3 trucks waiting because the silo wasn't as empty as we thought." At $150 to $300 per truck per hour of waiting time, the math adds up fast.
Case Study: 3D Scanning on a 6,000-Tonne Clinker Silo — Oman
A cement plant in Oman was running a single 6,000-tonne clinker silo with two radar level sensors. The silo was 28 metres in diameter, 42 metres tall. The plant reported persistent inventory discrepancies — physical stocktakes showed 8 to 15% less material than the radar readings indicated.
We installed a single 3D scanner during a planned 5-day shutdown. The scanner was mounted on the roof centre, connected via Modbus TCP to the existing Siemens S7-400 DCS. Commissioning took 1.5 days, including silo geometry programming and density calibration.
The first scan revealed the problem immediately. The silo had a permanent wall buildup ring at the 12-metre level — roughly 400 mm thick, extending 270 degrees around the circumference. The radar sensors, mounted at the centre, were measuring the top of the buildup ring and interpreting it as the material surface. The actual material level was 3.2 metres lower than the radar indicated.
Over the following 6 months, the plant used the 3D scanner's surface profile data to schedule a controlled descaling operation during the next major shutdown. Inventory accuracy improved from ±12% to ±1.8%. The procurement team reported a 23% reduction in emergency clinker transfers from the sister plant 140 km away.
Frequently Asked Questions
Q: Can a 3D scanner work in a silo that's being filled at the same time?
Yes. Modern scanners operate during filling, though the data quality degrades slightly during peak dust conditions. The scan cycle is fast enough — typically 30 to 90 seconds — that you get multiple readings per filling cycle. The system averages or selects the best reading based on signal quality. We don't recommend relying on a single scan during active filling; use the trend over 3 to 5 scans for operational decisions.
Q: What's the maintenance requirement for a 3D scanner?
Minimal. The scanner has no moving parts in contact with the material — it's mounted on the roof, looking down. Annual maintenance is a visual inspection of the lens or antenna surface, a check of the mounting flange seal, and a verification scan against a known reference. Total time: about 2 hours per year per unit. We've had scanners running for 7 years without a single hardware failure.
Q: Does 3D scanning replace weigh bins or load cells on the silo structure?
It complements them but doesn't fully replace them. Load cells on the silo legs measure total structural weight, which includes the silo shell, roof, internals, and material. They're accurate for mass measurement but give you no information about surface shape, rat-holes, or wall buildup. 3D scanning gives you volume and shape but depends on accurate density input for mass calculation. For the best inventory accuracy, we recommend both: load cells for mass, 3D scanning for volume and surface diagnostics. Together, they cross-check each other.
Need a 3D Level Scanning Solution for Your Silo System?
Manxing designs, engineers, and commissions complete silo systems — including level measurement, aeration, dust collection, and structural design — for cement, clinker, coal, fly ash, and other bulk materials. We've delivered silo projects across 30+ countries, from 500-tonne fly ash silos to 20,000-tonne clinker storage.
Tell us your silo diameter, material, and capacity. We'll spec the right scanning system and show you the integration plan.