
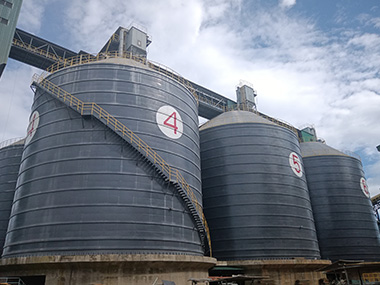

Steel Silo Thermal Sensor Mapping: A Field Engineer's Guide to Hotspot Detection in Bulk Storage
Thermal sensor mapping in steel silos is the systematic placement and calibration of temperature monitoring devices to detect abnormal heat buildup before it triggers material degradation, spontaneous combustion, or structural failure. Done right, it gives you a real-time thermal profile of your entire stored volume — not just a single-point alarm. Done wrong, you're flying blind with a false sense of security. Here's how we approach it at Manxing, based on projects across cement, coal, fly ash, and slag storage in 30+ countries.
Why Thermal Mapping Matters More Than a Single Alarm Point
Most silos ship with one or two temperature sensors. Usually mounted near the roof. That tells you the air temperature at the top of the silo — which is about as useful as checking the weather by looking at your ceiling.
The real danger zones are almost never at the top. They're deep in the material mass, where compaction, moisture migration, and exothermic reactions create isolated hotspots that can sit undetected for weeks.
The Physics You Can't Ignore
Bulk solids in a steel silo aren't thermally uniform. You've got at least three heat transfer mechanisms running simultaneously: conduction through the material bed, convection from aeration air, and radiation from the shell (especially on sun-exposed surfaces in places like the UAE or northern Australia where shell temperatures hit 65°C+ on a summer afternoon).
Coal is the obvious risk — oxidation starts around 50°C and accelerates exponentially past 70°C. But fly ash with residual carbon content can self-heat too. Cement with unreacted slag fractions generates hydration heat that can linger for months. Even sand with organic contamination has caught fire on us — I'm not kidding.
What Single-Point Monitoring Misses
A single sensor at the roof level might read 35°C while a hotspot at the 18-metre depth is sitting at 95°C. The thermal gradient in a static material bed is steep — we've measured 40°C differences over just 2 metres of vertical distance in a compacted coal silo.
The standard approach has a flaw nobody talks about: most plants set their alarm threshold at 60°C and think they're covered. By the time a roof-mounted sensor hits 60°C, the hotspot below has probably been cooking for 10-14 days. You're not getting an early warning. You're getting a late confirmation.
Sensor Types and Selection Criteria
Not all temperature sensors are created equal, and the wrong choice will either give you garbage data or fail within six months. I've seen both.
Resistance Temperature Detectors (RTDs) — PT100 and PT1000
For most industrial silo applications, PT100 RTDs are the workhorse. Accuracy of ±0.15°C at 0°C, good long-term stability, and they handle the vibration and dust environment better than thermocouples in our experience. We typically specify 3-wire or 4-wire configurations to eliminate lead resistance errors over long cable runs — and in a 30-metre silo, those runs add up.
PT1000 variants make sense when you're running long cable distances (over 150 metres) because the higher base resistance reduces the relative impact of lead wire resistance. We used PT1000s on a project in Kazakhstan where the control room was 280 metres from the silo. Signal integrity was noticeably better.
Thermocouples — When Speed Matters
Type K thermocouples respond 3-5 times faster than RTDs. That matters when you're monitoring a fast-moving process — like a blending silo where material turns over every 4-6 hours. But they're less accurate (±2.2°C for standard Class 1) and more susceptible to drift in high-dust environments.
We reserve thermocouples for applications where response time is the priority: pre-heater discharge silos, blending vessels, and any silo connected to a pneumatic conveying line where material temperature can spike within minutes.
Fiber Optic Distributed Temperature Sensing (DTS)
This is the gold standard for large-diameter silos, and it's getting more affordable every year. A single fiber optic cable can give you temperature readings every 1 metre along its entire length — that's hundreds of measurement points from one cable.
We installed DTS on a 12,000-tonne coal silo in Indonesia. The cable runs vertically from roof to cone, giving us a continuous thermal profile with 0.5°C resolution. Cost was around $18,000 for the system including the interrogator unit — expensive compared to point sensors, but when you're storing 12,000 tonnes of coal worth $1.2 million, the math works.
The catch: fiber optic cables are fragile during installation. We've had two cables fail during silo filling because of impact damage at the feed point. Now we always install a protective conduit through the feed zone.
Sensor Placement Strategy — The Mapping Grid
This is where most designs fall apart. Engineers place sensors evenly across the silo and call it a day. But heat doesn't distribute evenly, and your sensor grid shouldn't either.
Vertical Zoning
We divide the silo into three thermal zones, each with different sensor density:
Upper zone (top 25% of fill height): Lower sensor density. This region has the most variable temperature due to ambient fluctuations, solar gain on the shell, and fresh material intake. 2-3 sensors per cross-section is usually sufficient.
Middle zone (25-75% of fill height): This is where most hotspots develop. Material sits here longest, compaction is highest, and aeration is least effective. We place sensors every 3-4 metres vertically in this zone.
Lower zone (bottom 25%, including cone): High density again. Discharge patterns create stagnant pockets, and moisture tends to migrate downward. Plus, if material sits in the cone for extended periods, you get the worst compaction and the least natural cooling. Sensors every 2-3 metres here.
Radial Placement
The center of the silo is thermally isolated — surrounded by material on all sides with minimal heat loss. The shell region loses heat to the environment. Hotspots almost always develop in the core, not near the walls.
We place at least 60% of our sensors in the inner two-thirds of the silo radius. For large-diameter silos (over 20 metres), we run radial sensor strings at 120° intervals around the circumference, with sensors at 30%, 50%, and 70% of the radius from center.
On a 28-metre diameter cement silo in Vietnam, we installed 48 PT100 sensors on 8 vertical strings. Six strings at 60° intervals, each with 6 sensors. Took our crew three days to mount and wire. The plant manager thought we were overdoing it — until string 4, sensor 3 caught a 12°C anomaly that turned out to be a dead zone where aeration had failed. We fixed the aeration line before it became a problem.
Accounting for Aeration Patterns
Aeration doesn't distribute evenly. Air follows the path of least resistance, which means some regions get over-aerated (too cold, wasted energy) and others get almost nothing (hotspot risk). Your sensor grid needs to cover the dead zones — the areas between aeration pads where airflow is minimal.
We always request the aeration system layout before finalizing sensor positions. If the aeration designer won't share it, that's a red flag. On one project in South Africa, we found out during commissioning that the aeration pads were offset 15° from the drawings. Three of our sensor strings were directly above active aeration zones, giving us artificially low readings. Had to relocate them during a shutdown — not ideal.
Data Interpretation and Alarm Logic
Collecting temperature data is easy. Knowing what it means is hard. I've seen plants with 100+ sensors generating data nobody looks at, and plants with 6 sensors where the operator actually understands what's happening.
Absolute Thresholds vs. Rate-of-Change
Absolute temperature alarms are necessary but insufficient. A reading of 55°C in a coal silo might be normal during summer intake but abnormal during winter. Context matters.
We implement two alarm tiers on every project:
Rate-of-change alarm: Triggers when any sensor shows a temperature increase exceeding 3°C per hour over a 4-hour rolling window. This catches the early oxidation phase before absolute temperatures become dangerous.
Absolute threshold alarm: Material-specific. 60°C for coal, 70°C for fly ash with <5% LOI, 80°C for cement (where hydration heat is expected). These thresholds are set per EN 14491 guidelines for dust explosion prevention, adjusted for the specific material's thermal properties.
Spatial Correlation
A single sensor reading 5°C above baseline might be noise. Three adjacent sensors all reading 3-5°C above baseline in a vertical column — that's a hotspot developing. We program the control system to flag spatial clusters, not just individual points.
This is where DTS really shines. With continuous spatial data, you can see the thermal plume shape and track its migration. On the Indonesia coal project, we watched a hotspot move downward at roughly 0.3 metres per day as material was discharged from the bottom. That told us exactly when it would reach the discharge zone — and we scheduled an intervention 48 hours before it got there.
Integration with Process Control
Thermal data shouldn't live in isolation. We integrate it with:
- Fill/discharge status: A temperature rise during filling might be normal (hot fresh material). The same rise during a static period is alarming.
- Aeration flow rates: If aeration to a specific zone drops, expect temperatures there to rise within 12-24 hours.
- Material age tracking: If you know when each layer was deposited, you can correlate temperature with residence time. Material sitting for 90+ days in a coal silo is a known risk factor.
We follow ISO 15012 principles for dust explosion prevention in our alarm logic design — specifically, the requirement for early detection and automatic intervention before conditions reach the minimum ignition temperature of the dust cloud.
Field Tip: The 24-Hour Baseline Rule
Never set alarm thresholds on day one. Run the silo for at least 24 hours under normal operating conditions first, and use that data to establish your baseline thermal profile. Every silo is different — ambient conditions, material properties, and aeration patterns all shift the baseline. We've seen "normal" operating temperatures vary by 15°C between two identical silos at the same plant, just because one was in direct sunlight and the other was shaded by a preheater tower.
Case Study: Fly Ash Silo Thermal Mapping — Philippines
A 5,000-tonne fly ash silo at a cement plant in Luzon was experiencing intermittent quality complaints — the ash was arriving at the blending system with inconsistent fineness and occasional hard lumps. The plant suspected moisture ingress but couldn't locate the source.
We installed a 32-sensor PT100 grid: 8 vertical strings with 4 sensors each, concentrated in the middle and lower zones where material residence time was longest. Within 72 hours, the thermal map revealed a persistent 8-12°C hotspot in the northwest quadrant at 60% fill depth.
Turns out, the silo shell had a pinhole leak in that quadrant — monsoon rain was seeping in, causing localized hydration of the fly ash. The thermal signature was actually the exothermic reaction of CaO hydration, not oxidation. We patched the leak, purged the affected zone with dry aeration air, and the hotspot dissipated within five days.
Total sensor installation cost: approximately $4,200 including cabling and integration with the plant's existing SCADA system. The quality complaints stopped. The plant estimated they'd been losing $8,000-12,000 per month in rejected batches.
Installation Practicalities
The best sensor layout on paper means nothing if the installation is sloppy. Here's what we've learned the hard way.
Cable Routing and Protection
Sensor cables in a silo are subjected to abrasion, impact, chemical exposure, and UV degradation (near the roof). We run all cables through galvanized steel conduit inside the silo, with flexible stainless steel armored sections at any point where material flow could cause wear.
External cables run in cable trays with UV-resistant jackets. We specify minimum 1.5 mm² conductor size for RTD leads to keep resistance low, and all connections use IP67-rated junction boxes. Moisture in a junction box will give you erratic readings that look exactly like a real hotspot — I've been called out to "emergencies" that turned out to be a corroded terminal block.
Calibration and Verification
We calibrate every sensor against a reference thermometer before installation, and again after 30 days of operation. Drift of more than 0.5°C triggers replacement. For critical applications (coal, pet coke), we schedule quarterly calibration checks.
On a pet coke silo in Egypt, we found that 4 out of 24 sensors had drifted more than 2°C after six months. The dust was abrasive enough to thin the sensor sheaths, changing the thermal response time. We switched to heavy-wall 6mm sheaths and the problem stopped.
FAQ
How many sensors does a typical silo need?
It depends on diameter, height, and material risk. For a standard 1,000-tonne cement silo (roughly 8m diameter × 18m height), we typically specify 12-16 sensors. For a 10,000-tonne coal silo (25m+ diameter), 40-60 sensors is common. High-risk materials like coal or pet coke warrant roughly double the sensor density of low-risk materials like sand or limestone. There's no universal formula — we calculate based on thermal modeling of the specific geometry and material properties.
Can thermal sensors prevent a silo fire?
They can prevent most fires, if the alarm logic is right and someone responds. Thermal sensors detect the pre-combustion phase — the slow oxidation that precedes ignition by days or weeks. But sensors alone don't do anything. You need automated responses: increased aeration to the affected zone, accelerated discharge to remove the hot material, or nitrogen inerting for coal applications. We design our systems to trigger these responses automatically when rate-of-change thresholds are exceeded, because relying on a night-shift operator to notice an alarm at 3am is a gamble I'm not willing to take.
What's the typical cost range for a complete thermal mapping system?
For a medium-sized silo (2,000-5,000 tonnes) with 20-40 PT100 sensors, conduit, junction boxes, cabling, and PLC/SCADA integration, expect $6,000-15,000 USD depending on sensor count and cable run lengths. DTS systems for large silos run $15,000-35,000 including the interrogator unit. Annual maintenance (calibration, junction box inspection, cable integrity checks) runs about 8-12% of the initial installation cost. Compared to the cost of a single silo fire — which can exceed $500,000 in damage and lost production — the ROI is straightforward.
Need a Thermal Mapping Design for Your Silo?
At Manxing, we've designed thermal monitoring systems for over 200 silos across cement, coal, fly ash, slag, and minerals applications. We handle the full scope — sensor selection, placement engineering, control system integration, and commissioning support. Whether you're building a new silo or retrofitting an existing one, we'll give you a thermal mapping design that actually works in the field, not just on paper.