
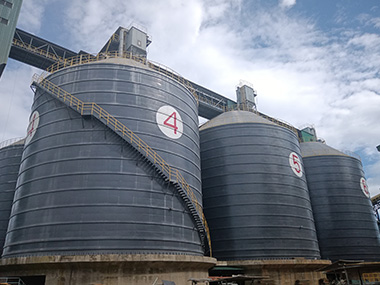

Steel Silo Vibration Monitoring Systems: What Actually Keeps a Silo Standing
Vibration monitoring on a steel silo isn't optional equipment — it's the difference between catching a structural problem at 2mm displacement and finding it at 200mm, when the shell's already buckling. A properly specified system gives you real-time frequency data, amplitude trends, and automated alarms tied to discharge cycles, aeration fan startups, and seismic events. Here's what works, what doesn't, and where most plants get it wrong.
Why Steel Silos Vibrate — and Why You Should Care
Every time a bulk solid hits the silo wall, a pressure wave travels through the steel. Most of the time, that's fine. The shell's designed for it. But vibration becomes a problem when it hits resonance, when it fatigues a weld, or when it signals something shifting inside that shouldn't be.
The Physics Nobody Explains at the Bid Stage
A 5,000-tonne cement silo standing 36 meters tall has a natural frequency somewhere between 1.2 and 2.8 Hz, depending on wall thickness, stored mass, and foundation stiffness. I've measured it on-site with accelerometers bolted to the shell — the numbers vary by 15-20% from the FEM model. That's normal. Steel isn't a perfect spring.
Now run a pneumatic conveying line at 6 bar, dumping 80 tonnes per hour into that silo. The impact zone near the inlet creates localized vibration at 4-8 Hz. The aeration pads at the bottom kick in at 0.5 Hz pulses. The discharge cone vibrates at 3-5 Hz when the screw feeder starts up. You've got three excitation sources, none of them synchronized, all of them hitting the same shell.
Here's where it gets interesting. If any of those frequencies lands within 10% of the silo's natural frequency, you get resonance. Amplitude doesn't just double — it can multiply by a factor of 10 or more. I've seen a 12-meter-diameter slag silo develop 4mm peak-to-peak shell oscillation at the hopper junction because a new rotary feeder happened to run at exactly the wrong RPM. Took us three days to figure it out. The feeder was running at 14 Hz. The silo's second-mode natural frequency was 13.6 Hz.
What Vibration Actually Tells You
Vibration data isn't just about structural health. It's a process diagnostic tool. A sudden shift in the dominant frequency during discharge usually means a blockage is forming — the material flow pattern changes, the center of mass shifts, and the vibration signature changes with it. We've caught rat-holes and bridging events 30-45 minutes before the level instruments flagged them, just by watching the spectral data.
Aeration system failures show up too. When a fluidizing pad clogs, the air distribution changes, the material flow becomes asymmetric, and you get a low-frequency sway component that wasn't there before. On a coal silo in Indonesia, we picked up a 0.3 Hz lateral oscillation that turned out to be a collapsed aeration membrane covering about 40% of the cone area. The operators hadn't noticed because the discharge rate looked normal — the material was just flowing through a channel instead of mass flow.
Sensor Types and What They're Actually Good For
You've got three main choices: accelerometers, velocity transducers, and displacement probes. Each one has a job. Using the wrong sensor for the application is like measuring temperature with a ruler — you'll get a number, but it won't mean what you think it means.
Accelerometers: The Workhorse
Piezoelectric accelerometers are what we specify for 90% of silo monitoring jobs. They cover 0.5 Hz to 10 kHz, they're rugged enough for outdoor mounting on a steel shell, and they cost $200-600 per unit depending on the IP rating and temperature range. For most steel silo applications, you're looking at a sensitivity of 100 mV/g, a measurement range of ±50g, and a frequency response down to about 1 Hz for the low-end models.
The catch? At very low frequencies — below about 0.5 Hz — the signal-to-noise ratio gets terrible. If you're monitoring slow sway modes on a tall, slender silo, you need a DC-response accelerometer (capacitive MEMS type), which costs 3-4x more but gives you clean data down to 0 Hz. We learned this the hard way on a 45-meter alumina silo in Queensland. The standard piezo units couldn't distinguish the 0.2 Hz sway from electronic noise. Switched to MEMS, and the data was immediately usable.
Velocity Transducers: When You Need Mid-Range Clarity
Velocity sensors output a signal proportional to vibration speed (mm/s), which is what most structural fatigue standards actually reference. ISO 10816-9 (which covers structural vibration on silos and storage tanks) uses mm/s RMS as its primary metric. If you're doing compliance monitoring against that standard, velocity transducers give you the most direct reading.
The downside is frequency range. Most electrodynamic velocity sensors roll off below 4 Hz and above 2 kHz. That's fine for monitoring structural modes but useless for detecting bearing defects on a rotary valve or gear mesh frequencies on a reducer. We use them as a complement to accelerometers, not a replacement — typically 2-4 velocity sensors on the lower shell and hopper, paired with 6-8 accelerometers distributed up the wall.
Displacement Probes: Niche but Critical
Eddy-current displacement probes measure gap distance directly. You'd use these for monitoring shell deformation relative to a fixed reference frame — say, measuring how much the silo wall moves laterally relative to the supporting structure. They're expensive ($800-1,500 per channel), they need careful mounting, and they only work over short distances (typically 0-10mm). But for a silo on a flexible steel frame in a seismic zone, they're the only tool that gives you direct displacement data.
We installed eight displacement probes on a clinker silo in Chile after a 6.4 magnitude earthquake caused 12mm of permanent lateral offset at the base. The probes gave us continuous monitoring at 0.1mm resolution. After two years of data, we could see the seasonal thermal expansion cycle — the shell moved 3-4mm east-west depending on ambient temperature. That kind of data is gold for understanding long-term structural behavior.
Sensor Placement: Where You Put Them Matters More Than What You Buy
I've seen plants spend $40,000 on a monitoring system and mount every sensor within a 2-meter radius because that's where the cable tray was convenient. The data was useless. Sensor placement is a structural engineering decision, not an instrumentation decision.
Mapping the Mode Shapes First
Before you drill a single hole in the shell, you need to know where the maximum displacements occur for each vibration mode. For a simple cylindrical silo on a rigid foundation, the first bending mode has maximum amplitude at the top and zero at the base. The second mode has a node at mid-height and peaks at the top and near the base. If you put all your sensors at the top, you'll miss the second mode entirely.
We run a modal analysis — either analytical (finite element) or experimental (impact testing with a roving accelerometer array) — to map the mode shapes. Then we place sensors at the antinodes of the first three or four modes. For a typical 30-meter cement silo, that means sensors at approximately 8m, 18m, and 28m above the foundation, with at least two sensors at each elevation 90 degrees apart to capture both in-plane and out-of-plane motion.
The hopper junction is another critical location. The stiffness discontinuity where the cylindrical shell meets the cone creates stress concentration and a local vibration mode that's independent of the overall shell behavior. We always put at least two accelerometers within 1 meter of the hopper-to-shell weld, oriented radially and tangentially.
Environmental Protection and Mounting
Steel silos live in harsh environments. Cement dust is abrasive and conductive when it absorbs moisture. Coal dust is explosive. Fly ash is alkaline and corrosive. Your sensor mounting has to survive all of that.
We use welded stud mounts with a minimum M6 thread, surface ground flat before installation. Adhesive mounts are faster but they fail — I've pulled three off a silo wall in Vietnam after 18 months of thermal cycling. The adhesive softened at 65°C surface temperature (direct sun on a black-painted shell) and the sensor fell off. Now we specify welded studs for anything above 40°C ambient, and adhesive mounts only for temporary monitoring campaigns.
Cable routing matters too. We run signal cables in galvanized steel conduit, sealed at every junction box with IP66-rated glands. The conduit is welded to the shell at 1.5-meter intervals — no plastic cable ties, no P-clips with rubber grommets. UV degradation on a silo in the Middle East will destroy a plastic tie in 18 months. I've seen cables hanging loose after a wind storm because someone saved $200 on conduit.
Data Acquisition and Alarm Thresholds
Collecting vibration data is easy. Interpreting it correctly is where most systems fail. You need to separate normal operational vibration from abnormal structural response, and you need to do it automatically, because nobody's watching a trend graph at 3am.
Setting Thresholds That Actually Mean Something
ISO 10816-9 defines vibration velocity zones for steel structures: Zone A (normal) below 2.3 mm/s RMS, Zone B (acceptable) up to 4.5 mm/s, Zone C (alert) up to 11 mm/s, and Zone D (danger) above that. These are generic guidelines for steel structures — they're a starting point, not a final answer.
For a welded steel silo shell, we typically set the alert threshold at 5 mm/s RMS in the 1-10 Hz range and 8 mm/s RMS in the 10-100 Hz range. The lower threshold for low-frequency content reflects the fact that shell buckling is driven by low-frequency oscillation, while high-frequency vibration (from aeration, conveying impacts) is less structurally significant at the same amplitude.
But here's the thing — those thresholds assume steady-state vibration. A silo during filling has completely different vibration levels than one during discharge. We set conditional thresholds: one set for filling mode, one for discharge mode, one for idle. The system reads the process state from the plant DCS (conveyor running, feeder running, aeration on/off) and applies the appropriate thresholds automatically. Without this, you get false alarms every time the discharge cycle starts.
Frequency Analysis vs. Overall Level Monitoring
Overall vibration level (mm/s RMS) tells you something's wrong. Frequency analysis tells you what's wrong. You need both.
A sudden increase in overall level at 2 Hz during discharge? Probably a flow channel forming — asymmetric mass distribution creating a sway mode. A spike at 15 Hz that comes and goes? Likely a bearing defect on a rotary valve or unlevelizer. A broadband increase across 5-50 Hz? Could be a weld crack propagating — the stiffness reduction shifts multiple modes simultaneously.
We configure the monitoring system to perform FFT analysis on every sensor channel at least once per minute, with a frequency resolution of 0.25 Hz. The system stores the full spectrum for 30 days and trend data (peak frequency, peak amplitude, overall RMS) permanently. When an alarm triggers, the operator sees not just "Sensor 3 exceeded threshold" but "Sensor 3: dominant frequency shifted from 2.1 Hz to 1.7 Hz, amplitude increased from 1.2 mm/s to 4.8 mm/s — possible asymmetric flow condition."
Integration with Plant Control and Safety Systems
A vibration monitoring system that lives in isolation is half a system. The real value comes when it talks to the plant control system and can actually do something when it detects a problem.
Communication Protocols and Architecture
Most modern monitoring systems support Modbus TCP, which integrates directly with the plant DCS or PLC. We specify Modbus TCP as the primary interface, with 4-20 mA analog outputs as a backup for critical alarm channels. The monitoring system publishes vibration levels, alarm states, and diagnostic messages to the DCS, and the DCS publishes process state (filling/discharge/idle, equipment running status) back to the monitoring system.
For larger installations — say, a terminal with 12 silos — we use a dedicated monitoring server with OPC UA connectivity. The server aggregates data from all silo monitoring units, runs trend analysis, and provides a web-based visualization interface. The plant operators see it on the same HMI screens they already use. No separate workstation, no separate login, no "go check the vibration system" — it's just another set of tags in the DCS.
Automated Responses and Interlocks
This is where it gets serious. When vibration exceeds the danger threshold, the system should be able to act without waiting for an operator to read the alarm and make a decision. We typically configure three levels of automated response:
Level 1 (Alert — 5 mm/s): Log the event, notify operators via DCS alarm, trigger a high-speed data capture (10 kHz sampling for 60 seconds) to record the event in detail.
Level 2 (Alarm — 8 mm/s): Automatically stop filling operations, stop aeration, and hold the discharge feeder at current speed. Notify the shift supervisor via SMS.
Level 3 (Emergency — 12 mm/s or rate-of-change > 5 mm/s per minute): Stop all material flow into and out of the silo, activate the emergency discharge bypass (if configured), and trigger a plant-wide alarm. This level indicates imminent structural failure — you don't wait for a human to decide.
I'll be honest — some plant managers don't want automated interlocks. They're worried about false alarms shutting down production. Fair concern. That's why we spend so much time on threshold configuration and conditional logic during commissioning. A well-tuned system should have fewer than two false alarms per year. If you're getting more than that, the thresholds are wrong or the sensors are poorly installed.
Case Study: Coal Silo Vibration Crisis at a Power Plant
A 2,500-tonne coal silo at a 600 MW power plant in the Philippines started showing intermittent vibration alarms six months after a new PLC-controlled feeding system was installed. The plant's maintenance team had installed a basic vibration switch (single-threshold, on/off) on the hopper, and it was tripping randomly during discharge cycles.
We were called in to diagnose. First thing we did was install a temporary monitoring system — 8 accelerometers on the shell, 2 on the hopper, 1 on the roof — running for 72 hours to capture a full operational cycle. The data was revealing.
The new feeding system used a variable-speed belt feeder that ramped up from 0 to 100% speed over 45 seconds. During the ramp-up, the feeder passed through a speed range (22-28 RPM) that excited the silo's first lateral mode at 1.8 Hz. The resulting resonance produced peak shell vibration of 7.2 mm/s — well into ISO 10816-9 Zone C. It only lasted 8-12 seconds per cycle, but it was happening 40-60 times per day.
The fix was simple: we reprogrammed the feeder ramp profile to skip the 22-28 RPM range, accelerating through it in under 2 seconds instead of dwelling there for 10 seconds. Peak vibration dropped to 2.1 mm/s. Problem solved in one afternoon, after the plant had spent three months replacing the vibration switch four times because they kept thinking it was a sensor fault.
The permanent monitoring system we installed afterward — 10 accelerometers, Modbus TCP to the plant DCS, conditional thresholds for filling/discharge/idle modes — cost approximately $28,000 including installation. The plant had been losing an estimated $15,000 per month in emergency maintenance callouts and unplanned downtime. Payback period: under two months.
FAQ
Q: How many vibration sensors does a typical steel silo need?
For a standard cylindrical steel silo up to 30 meters tall, we recommend 8-12 accelerometers distributed up the shell, plus 2 near the hopper junction and 1 on the roof. Larger silos (40m+) or those with complex geometries (stiffened shells, eccentric discharges) may need 16-20 sensors. The exact number depends on the modal analysis — you need enough sensors to capture the first four or five mode shapes without spatial aliasing.
Q: Can vibration monitoring detect material buildup or wall adhesion?
Yes, indirectly. Material buildup changes the effective mass of the silo, which shifts the natural frequencies downward. A 10% increase in wall buildup (say, 50 tonnes of cement clinging to the walls of a 5,000-tonne silo) will drop the first natural frequency by approximately 5%. If you're tracking frequency trends over weeks and months, you can detect buildup before it becomes a flow problem. We've used this approach on slag silos where wall adhesion is chronic — the frequency trend gives the maintenance team a quantitative trigger for scheduling cleanout.
Q: What's the typical cost of a complete vibration monitoring system for a steel silo?
For a complete system — sensors, data acquisition hardware, cabling, software, commissioning, and DCS integration — expect $20,000-45,000 for a single silo, depending on sensor count and complexity. Multi-silo installations benefit from shared infrastructure and typically run $15,000-30,000 per silo for 4 or more units. Annual maintenance (calibration verification, sensor replacement, software updates) runs about 5-8% of the initial capital cost. Compared to the cost of a single unplanned shutdown or structural repair, it's not even a rounding error.
Get It Right From the Start
Vibration monitoring isn't something you bolt on after the silo's built and problems start showing up. It should be part of the original design — sensor mounting provisions in the shell, cable conduit routed during fabrication, DCS communication architecture planned from day one. Retrofitting is always more expensive and almost always less effective.
At Manxing, we design vibration monitoring into every silo EPC project where the stored material, operating cycle, or structural configuration warrants it. That means most of them. We've installed monitoring systems on silos storing cement, clinker, coal, fly ash, slag, alumina, and granular sand across 30+ countries. We know what the data looks like when things are normal, and we know what it looks like 30 minutes before they're not.
If you're planning a new silo project or retrofitting monitoring onto an existing one, talk to our engineering team. We'll tell you exactly what you need — and what you don't.
```