
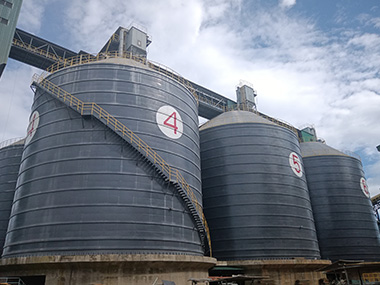

Steel Silo Operational Efficiency Metrics: What to Measure and Why
Operational efficiency metrics for steel silos boil down to two numbers: effective utilization rate (actual live storage capacity divided by nominal design capacity, typically 70–85% for well-managed facilities) and discharge reliability (the percentage of scheduled discharge events that complete without interruption, targeting 98%+). These two figures tell you whether your silo is earning its footprint or quietly hemorrhaging throughput. Below, I'll walk through the specific metrics, measurement methods, and benchmarks that separate a silo system that works from one that merely exists.
1. Capacity Utilization — The Number Nobody Tracks Correctly
Most plant managers think utilization is simple: current inventory divided by design capacity. It isn't. That calculation ignores dead zones, angle-of-repose losses, and the fact that you can't safely fill a cement silo to 100% of its geometric volume without risking over-pressurization during pneumatic filling.
1.1 Live Storage vs. Dead Storage
The first cut you need to make is between live and dead storage. Live storage is the volume material can reach through normal gravity flow. Dead storage is everything below the outlet cone that requires mechanical extraction or manual intervention. In a typical bolted steel cement silo with a 60° cone, dead storage accounts for 8–12% of total geometric volume. For a 3,000 m³ silo, that's 240–360 m³ you're paying to build but can't reliably access without a fluidization system running.
I reviewed a clinker silo in Vietnam last year where the operations team reported 92% utilization. Their calculation used total geometric volume as the denominator. When we recalculated using live storage only — accounting for the 10% dead zone and the 5% safety margin required by EN 1991-4 for stored bulk solids — their real utilization was 78%. That's a completely different conversation about whether they needed a second silo or better discharge aids.
1.2 Angle of Repose and Fill Geometry
Bulk solids don't fill a silo like water fills a tank. The surface slopes. For cement, the angle of repose typically runs 30–35° from horizontal after settling. For coal, it can be 40–45°. This means the upper portion of a cylindrical silo never reaches full capacity — there's a cone of empty space at the top.
The math: for a silo with a 15 m diameter and 30 m straight side, the top cone volume loss at 32° repose is approximately 85 m³. On a 10,000-tonne cement silo (roughly 7,700 m³ at 1.3 t/m³ bulk density), that's about 1.1% of total volume. It sounds small, but multiply it across 8 silos running 340 days a year at 500 tonnes per day throughput, and you're talking about 14,000 tonnes of lost annual handling capacity. That's not trivial.
1.3 The 85% Rule
Here's a number I use as a sanity check: if your utilization rate consistently exceeds 85% of geometric capacity, something is wrong. Either your level measurement is inaccurate, your safety margins are being ignored, or your material is compacting in ways that will cause a bridging event within the next 48 hours. I've seen all three.
The benchmark for a well-run industrial silo is 75–82% effective utilization of geometric capacity. Below 70% and you're over-capitalized. Above 85% and you're one bridge-away from a shutdown.
2. Discharge Reliability and Flow Rate Consistency
A silo that fills reliably but discharges intermittently is worse than useless — it's a bottleneck that disguises itself as storage. Discharge problems are the single most common reason plants call us for a retrofit, and they almost always trace back to one of three root causes: material consolidation, inadequate fluidization, or an undersized discharge system.
2.1 Mass Flow vs. Funnel Flow Performance
The flow pattern inside your silo determines everything about discharge reliability. Mass flow — where all material moves during discharge — gives you first-in-first-out behavior, predictable discharge rates, and minimal segregation. Funnel flow — where a central channel forms and material trickles down from the sides — gives you erratic discharge, aging inventory, and a 30–50% reduction in effective live storage.
The Jenike Shear Tester method (per ASTM D6128) lets you determine your material's flow function and match it to the hopper geometry needed for mass flow. For cement with a wall friction angle of 26° against your steel liner, you'll need a hopper half-angle no steeper than about 21° from vertical to achieve mass flow in a conical hopper. Steeper than that, and you're in funnel flow territory whether your drawings say otherwise.
I've walked into plants where the original design specified a 17° hopper half-angle for mass flow, but the contractor built it at 24° to save steel. The silo worked — for about six months. Then the cement started aging in the dead zones, moisture migrated to the walls, and within a year they were running a bin activator on every discharge cycle just to keep material moving. The retrofit cost more than the original steel savings by a factor of four.
2.2 Discharge Rate Variability
Measure your actual discharge rate over 50 consecutive cycles. Calculate the standard deviation as a percentage of the mean. For a properly functioning cement silo with an aerated cone and a properly sized blower, you want coefficient of variation below 8%. Above 15% and you've got a problem — either erratic aeration, a partially blocked fluidization pad, or material conditioning that's inconsistent.
On a project in Saudi Arabia, we tracked discharge rates on a 5,000-tonne fly ash silo over three weeks. The mean rate was 180 tonnes per hour, but the standard deviation was 31 t/h — a CV of 17.2%. The root cause: the air compressor supplying the fluidization pads was cycling on and off instead of running continuously with a pressure-reducing valve. The fix cost about $2,000 in piping modifications. The improvement in throughput consistency was worth $40,000 per month in avoided conveyor downtime.
2.3 Bridge and Rathole Detection
Your level measurement system should do more than report inventory. It should detect anomalies that indicate flow problems. A sudden drop in level followed by no change for an extended period — that's a bridge. A sustained low-level reading while discharge equipment is running — that's a rathole.
Modern radar level transmitters (per IEC 62961 for solid applications) can resolve level changes of ±5 mm in a 30 m silo. That resolution is enough to detect the early signature of a forming bridge — a localized level depression that doesn't propagate. If your system can't resolve better than ±50 mm, you're flying blind on flow problems.
3. Energy Efficiency — The Hidden Operating Cost
Energy costs for silo operations don't show up on most project budgets because they're distributed across multiple systems: aeration blowers, dust collectors, conveyors, and temperature monitoring. But they add up. For a 5,000-tonne cement silo, annual energy consumption for aeration and dust collection alone typically runs 80,000–120,000 kWh. At $0.10/kWh, that's $8,000–$12,000 per year — just to keep material fluidized and the top of the silo under negative pressure.
3.1 Aeration Energy per Tonne Discharged
The metric that matters is kWh per tonne of material discharged. For cement, a well-designed aeration system with properly sized pads and a pressure-reducing manifold should consume 0.15–0.25 kWh per tonne. For abrasive materials like clinker or slag, where pad wear is higher and you need higher air pressure, expect 0.30–0.45 kWh per tonne.
We benchmarked a coal silo in South Africa where the aeration system was pulling 0.62 kWh per tonne — double the expected value. The fluidization pads had been installed with the air supply manifold at the wrong elevation, creating a 150 mm offset that forced the blower to work against an additional 15 kPa of back-pressure. Relocating the manifold took two days. The energy savings paid for the modification in six weeks.
3.2 Dust Collector Energy and Filter Life
Your silo top dust collector is a continuous energy consumer. A typical pulse-jet baghouse for a 5,000-tonne silo runs a 7.5 kW compressor and a 5.5 kW exhaust fan, cycling 8–12 hours per day during filling operations. Annual energy: roughly 45,000–65,000 kWh.
The real cost driver, though, is filter replacement. A baghouse operating at a differential pressure above 1,500 Pa is working too hard — either the filter media is blinded, the pulse cleaning system is underperforming, or the air-to-cloth ratio is too high. Clean filters at 800–1,200 Pa differential should give you 18–24 months of service life. If you're replacing bags every 8 months, your energy costs are probably 30–40% above what they should be, because the system is constantly pushing against a clogged filter bank.
ISO 15012 gives you the framework for evaluating dust collection system performance. Use it. Specifically, the standard's guidance on filter media selection for different dust characteristics will save you from the common mistake of specifying the same filter media for cement and coal — they have completely different adhesion and moisture characteristics.
4. Material Quality Preservation Metrics
Storage isn't just about holding material — it's about holding it in a condition that meets your process requirements. For cement, that means preventing moisture ingress and controlling temperature. For coal, it means preventing oxidation and self-heating. For fly ash, it means maintaining consistent chemical composition.
4.1 Temperature Monitoring and Control
Install temperature sensors at a minimum of three elevations in any silo storing material above 5,000 tonnes. For cement, the critical threshold is 65°C — above that, you're at risk of pre-hydration and strength loss in the final product. For coal, the threshold is 60°C sustained for more than 24 hours, which indicates active oxidation.
A project in Indonesia taught me this lesson the hard way. A 10,000-tonne coal silo had a single temperature sensor at mid-level. The sensor read 42°C — normal. What it didn't detect was a 78°C hotspot at the wall, 2 m below the surface, where moist coal had been sitting against a poorly sealed wall panel for three weeks. By the time the smell reached the plant manager, the coal in that zone had degraded from 28 MJ/kg to below 22 MJ/kg. We ended up having to blend 4,000 tonnes of off-spec coal back into the feed stream over two months. The temperature monitoring retrofit — 12 sensors at four elevations — cost $8,500. The coal degradation cost them $340,000.
4.2 Moisture Ingress Prevention
For cement and fly ash, moisture is the enemy. A silo shell that's properly sealed should maintain internal relative humidity below 40% in most climates. If you're seeing humidity above 60% inside a closed steel silo, you've got a leak — either at a panel joint, a roof penetration, or a manway door.
The test is simple: measure the dew point of the headspace air and compare it to ambient. If they're within 3°C of each other, the silo is breathing with the atmosphere. That means your seals have failed somewhere. On a 15 m diameter silo, a 2 mm gap at one panel joint can admit 15–20 m³ of humid air per day through thermal breathing alone. Over a month, that's enough moisture to cause measurable cement quality degradation.
GB 50295-2016 (the Chinese code for cement plant design) specifies a maximum air infiltration rate of 0.5 air changes per hour for cement storage silos. Most plants I visit are running 2–3 air changes per hour. That's not a design problem — it's a maintenance problem, and it's fixable with a weekend of sealant work.
5. Structural and Safety Performance Indicators
Operational efficiency isn't just about throughput. A silo that's structurally compromised is a silo that's about to become very inefficient in a catastrophic way. The metrics here are less about daily operations and more about long-term asset integrity.
5.1 Wall Thickness Monitoring
Abrasive materials — clinker, slag, alumina, sand — will eat through a steel silo wall. For cement, wall loss is typically 0.02–0.05 mm per year. For clinker, it's 0.1–0.3 mm per year. For alumina, it can be 0.5 mm per year or more.
If you installed 6 mm wall panels, and you're storing clinker at 0.2 mm/year loss rate, you've got a 30-year theoretical service life before you hit the minimum structural thickness. But that's assuming uniform loss. In reality, abrasion is concentrated at fill points, discharge cones, and anywhere material impacts the wall. Localized loss rates can be 3–5 times the average.
Measure wall thickness annually using ultrasonic testing (per EN 14127). Focus on the lower third of the silo shell and the cone section. When local thickness drops below 70% of original, you need a repair plan — not next year, now.
5.2 Bolted Connection Integrity
For bolted steel silos, the connections are the structure. A single missing or under-torqued bolt in a critical seam can initiate a progressive failure. The standard torque for M16 high-strength bolts in a bolted silo connection is 220–260 N·m. If you're finding bolts at 150 N·m or below during inspection, that connection has loosened — either from vibration, thermal cycling, or initial under-torquing during construction.
I've seen a silo in the Philippines where 14 bolts in the lower course had backed out completely over two years. The panel seam had opened to a 3 mm gap. It was caught during a routine inspection, not during a failure. The re-torque and replacement took four hours. The potential consequence — a 5,000-tonne cement silo losing structural integrity in a typhoon — doesn't bear thinking about.
Per EN 1993-1-8 (Eurocode 3, design of joints), bolted connections in silo structures should be inspected at intervals not exceeding 24 months. I recommend 12 months for silos in high-vibration environments or seismic zones.
Case Study: Cement Silo Efficiency Audit — Morocco
A cement plant in Morocco contacted us about two 8,000-tonne cement silos that were "not performing." The plant manager's complaint: they couldn't achieve their target discharge rate of 250 t/h, and inventory reconciliation was consistently off by 5–8%.
We spent four days on site. Here's what we found:
Discharge rate: The actual sustained rate was 165 t/h, not 250. The aeration system was running at 60% of design air volume because the blower intake filter was clogged (differential pressure across the filter: 3,200 Pa vs. a clean filter at 400 Pa). The fluidization pads were also partially blinded with cement dust — a maintenance issue, not a design issue. Cleaning the filter and replacing the pads brought the rate to 275 t/h within one day.
Inventory discrepancy: The radar level system was calibrated for a bulk density of 1.25 t/m³, but the actual cement bulk density was 1.38 t/m³ due to a change in fineness. That 10% density error translated directly into a 10% inventory error. Recalibrating the level system with the correct density and adding a load-cell-based weight measurement for reconciliation brought the discrepancy below 1.5%.
Energy consumption: Aeration energy was 0.41 kWh per tonne — nearly double the expected 0.22 kWh/t. The root cause was the clogged filter forcing the blower to work at higher pressure. Post-fix energy consumption dropped to 0.19 kWh/t. Annual savings: approximately $14,000 in electricity costs for two silos.
Total cost of the fixes: $6,200 (filter elements, fluidization pads, calibration labor). Payback period: less than two months. The silos weren't poorly designed — they were poorly maintained. That's the story I hear on 70% of the efficiency audits I do.
FAQ
Q: What is a good utilization rate for a cement silo?
A: 75–82% of geometric capacity is the target range for cement. Below 70% and you're over-invested in storage. Above 85% and you're operating without adequate safety margin — one bridging event away from an emergency shutdown. The key is measuring against geometric capacity, not live storage capacity, because you need to account for the dead zone and the angle-of-repose losses that are always present.
Q: How often should I inspect a bolted steel silo?
A: Visual inspection quarterly, detailed structural inspection annually, and ultrasonic wall-thickness testing every 12–24 months depending on material abrasiveness. For clinker or alumina silos, do the thickness test every 12 months. For cement or fly ash, 24 months is usually adequate. Bolted connection torque checks should be part of the annual inspection — focus on the lower courses and the cone section where loads are highest.
Q: What discharge rate variability is acceptable?
A: Coefficient of variation below 8% over 50 consecutive discharge cycles. If you're above 15%, investigate immediately — the problem will only get worse. The most common causes are erratic aeration (check your blower and filter), partial blockage of fluidization pads, or material consolidation from moisture ingress. Measure it. Track it. When the number starts climbing, you've got a window of a few weeks before it becomes a production problem.
Need Help Measuring or Improving Your Silo Performance?
Manxing has designed, built, and commissioned steel silo systems across 30+ countries for cement, clinker, fly ash, coal, slag, and mineral plants. Our EPC team handles everything from structural design and material flow analysis to commissioning and operator training. If your silos aren't meeting their design performance — or if you're planning a new installation and want to get the metrics right from day one — contact us at manxingstorage.com for a technical consultation. We'll tell you what's wrong, what it'll cost to fix it, and whether it's worth fixing or replacing.